RIP Bad Data
How can you prepare a meal without the necessary materials and ingredients? How can you move from Point A to Point B without actually taking a step?
The place of Data Preparation is not as pronounced as all other things data. Yet most analysts who work with data agree that up to 80% of their time is spent cleaning data and only the remaining 20% on the actual objective – Analyzing Data for Decision Making. Before the beautiful end products coming out from that Power BI, Tableau, SQL, Qlik, R, Python, whatever, lies a demon called dirty data.
Dirty data can come in different types, forms and shapes. Even colors. Missing Values, Duplicates, Data Entry Blunders, Data Type Inconsistencies. You will never see it all. Some of the most notorious ones I have seen include:
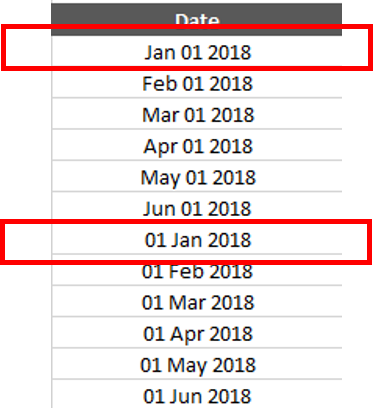
- Using different date formats within the same column. Some entered as Day/Month/Year and others as Month/Day/Year.
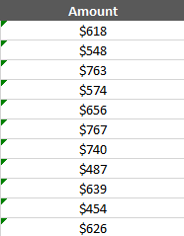
- Entering special characters in a numeric column/field. e.g, adding the dollar sign to figures in the column. (I am not talking about formatting the field as currency type)
- Adding units of measures to Values in a column. e.g, 5Litres, 45cm.
- Using the letter “O” instead of 0 (zero) in a numeric field. Or, the letter “I” instead of figure 1.
- Writing the same Item in many different ways within a column. For example, in a column for city, having “Lagos”, “Lag”, “Lg”, “Lagos “, “Laos”. (Notice Lagos appears twice: One has an extra space in front.
Imagine having to check through millions of records for such notorious issues. If you have such issues, I envy you (Because I love cleaning dirty data)
Through all of these, it takes a very experienced and highly skilled analyst to use a tool of choice to clean dirty data. I will talk about my tool of choice in a bit.

The best tool for cleaning data is the mind. Yes, the Mind. According to Wikipedia (Not a good source to quote but what I saw there made sense), “The mind (not to be confused with the brain) is a set of cognitive faculties including consciousness, imagination, perception, thinking, judgement, language and memory. It is usually defined as the faculty of an entity’s thoughts and consciousness”
This is all one needs to clean any data. Not all actually, but the bulk of it.
- If you are going to be successful at killing any kind of bad data thrown at you, your mind has to be at the top of its game.
- You will be conscious of the dirt and you’ll be conscious of the actions you are taking to clean the dirt.
- Your mind will wonder in imagination, first as to how the mess was created, and then how to clean it. To catch a thief, you’ll have to behave like one.
- You must understand the data in your head. You must see it with your eyes (in some cases, your inner eyes), interpret with your mind.
The whole of your thinking faculty continues to work through put the process. The way you clean some bad data will sometimes make you think you are a criminal.

Here are my general tips for cleaning data:
1. Put on your Mind and activate your cognitive faculties (Consciousness, Imagination, Perception, Thinking, Judgement, Memory and may be your sense of smell too, you want to be able to smell trouble)

2. Access your data to identify what makes it dirty. You should can use these guides to carry out your general assessments:
- Does each column/field have a heading? A single heading. If there is something within your data that doesn’t carry a Heading, give it a heading or remove it If it’s so useless. Let there be no more than one row of headings.
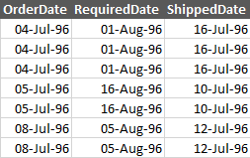
- Do you have dates? Each date description should be on its own column/field. For example, all Transaction Dates should be on a single column and all Effective Dates should be on a separate column.
- Similarly, all data points belonging to the same category should be on a single column. For example, If you have data points for Nigeria, Ghana, USA, Africa, Europe. Let Nigeria, Ghana and USA be on one column while Africa and Europe should be on a separate column.
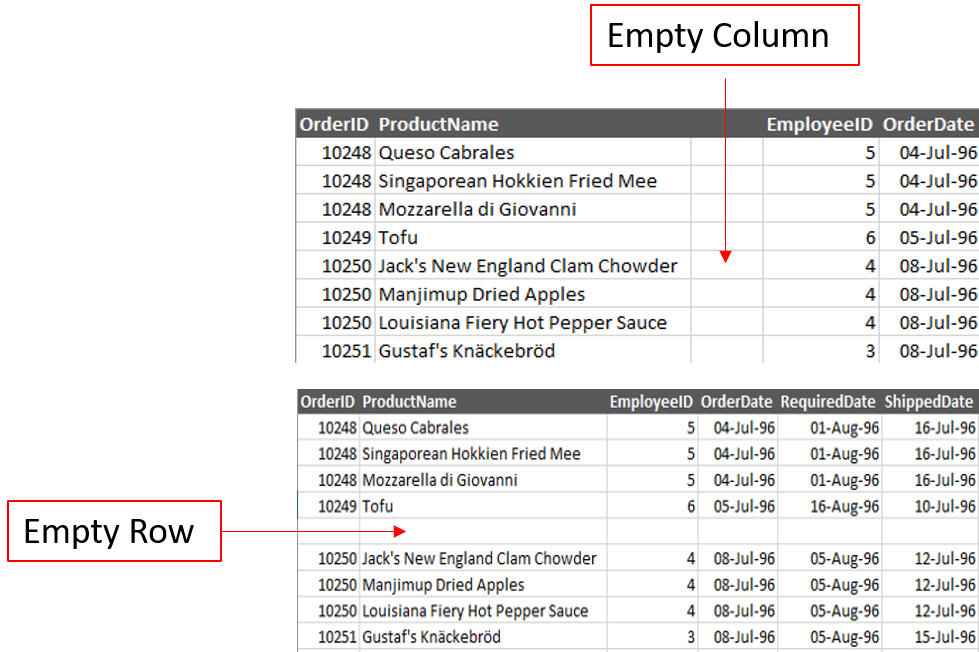
- Do you have empty rows/columns? Delete empty rows and empty columns. A row is considered empty if there are no entries on every column/field for that row. A column is empty if there are no entries on all the rows on that column
- Do you have totals/subtotals? Delete all totals and subtotal lines to avoid double counting in your analysis
- Are there empty values? Fill them up as appropriate. You may use zeros to fill up empty numeric values for example.
- Are there any irregular issues with the data? Such as the notorious issues earlier stated. Note them
- If you find anything wrong from the assessment, have a clear idea of what to do about it.
3. Use your tool of choice to carry out data cleansing.
Never confuse a report for data. A report can come in any format, but data must align to a structure as stated on the guide number 2 on the list above.
Fortunately or unfortunately for some people, the data they require for their analysis is someone else’s report. You must be able to reshape it from a report structure to data structure.
One tool that does an amazing job (understatement) at cleaning data is the Microsoft Power Query. It is my tool of choice. All you’ll be doing is pointing and clicking away till your data is clean. Power Query is a Microsoft ETL (Extract, Transform and Load)tool available on both Power BI and Excel. It runs on a powerful language – M. I will write a fully dedicated post about Power Query in my next article.
Until then, remember, Cleanliness is next to Godliness. Clean data is essential to Data Analysis.


