Intro
DAX is a Data Analysis EXpression language used in Power BI.
I attended a Power BI conference sometimes last year where Ahmed Oyelowo mentioned the importance of knowing the theoretical aspect of the language.
Before diving fully into the practical in order to understand the rudiments of how the functions work and getting comfortable with it.
But before that, I will give a brief explanation of DAX.
They are created to achieve different purposes of analysis.
- It could be for calculating a new column
- modifying an existing column and
- creating measures
A DAX formula can be made up of components like:
- functions (SUM, AVERAGE, etc)
- operators (arithmetic operators +, -, /)
- comparison /relational operators (<,>,)
- logical operators (and(&&), or(||), not)),
- column names
- conditional statements and so on.
DAX Terms / Functions
Here are some important terms/functions you should know when starting out in DAX.
1. EVALUATION CONTEXT
This explains how DAX formulas are being processed. It is in two categories: FILTER and ROW CONTEXT.
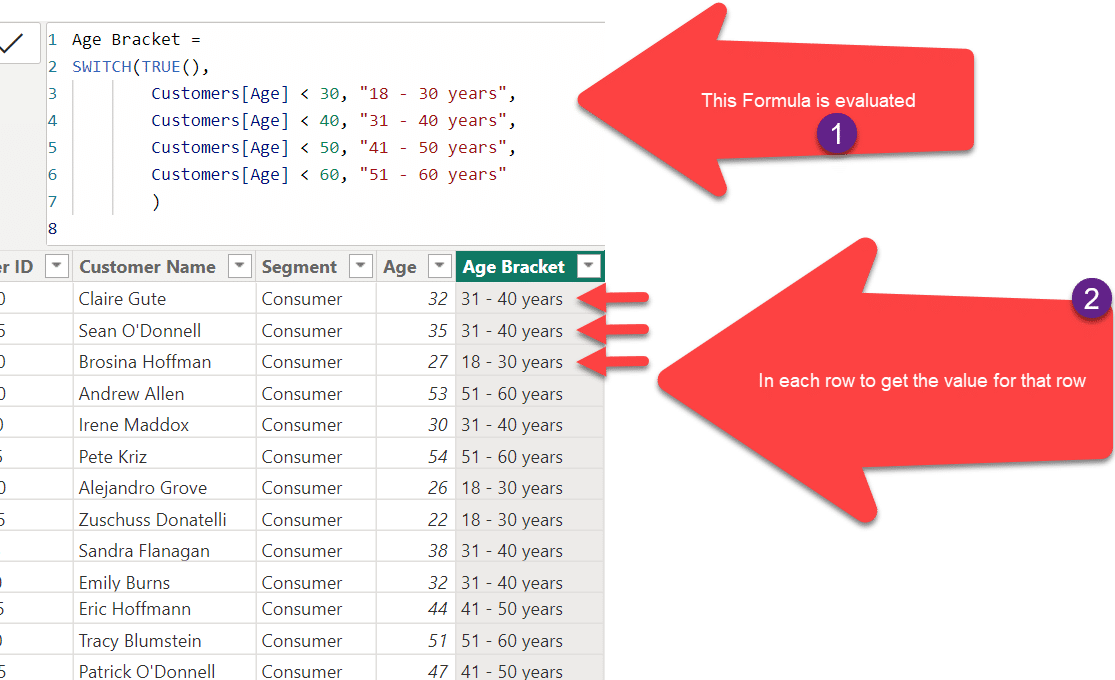
- ROW CONTEXT– Expressions are evaluated on a row-to-row basis.There are two instances at which this happens.Firstly, when creating a new column in your data which is basically an additional way to describe your data.For example creating a new column for age group so as to group each age in a particular bracket.
Secondly, using the X functions such as SUMX, MINX, MAXX and so on.
It allows the calculated column and X functions perform operations on the current table one row at a time. This can also be known as iterating over a table.
When this happens, the filter on the row of that table is deactivated.
- FILTER CONTEXTI know this (Filter) was mentioned in the last statement above and you might be wondering what it exactly means.Filter context is the active relationship you have built in your data model, that feeds into a report visualization.For example, you have already created a relationship between your date table and the sales table.
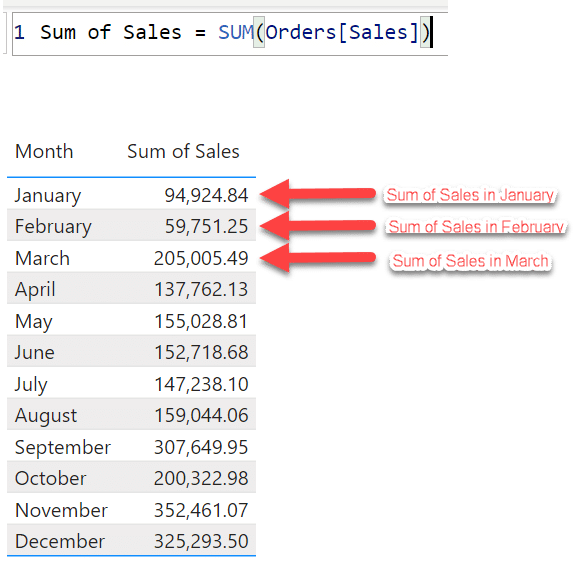
When visualizing, you might want to check for total sales across each month (by bringing in your total sales and month column).
What happens here is that it automatically filters down your total sales based on each month.
3. CALCULATE FUNCTION
Sometimes, you might want to override or modify the default filter context.
And this is when the CALCULATE function comes in.
I find it really pleasing on days I use the function the most!
It allows you to re-evaluate an expression within a modified filter context.
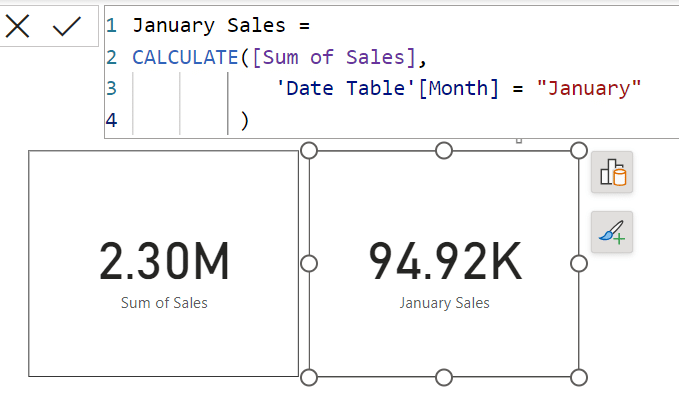
For example: You are only interested in checking your total sales for only the month of January and not for all the months.
What CALCULATE does is that it takes whatever the current filter is and modify it to only sales in January and boom! Problem solved.
3. NAVIGATION FUNCTIONS
I mentioned where your filter on a particular table is deactivated when creating a new column or X functions.
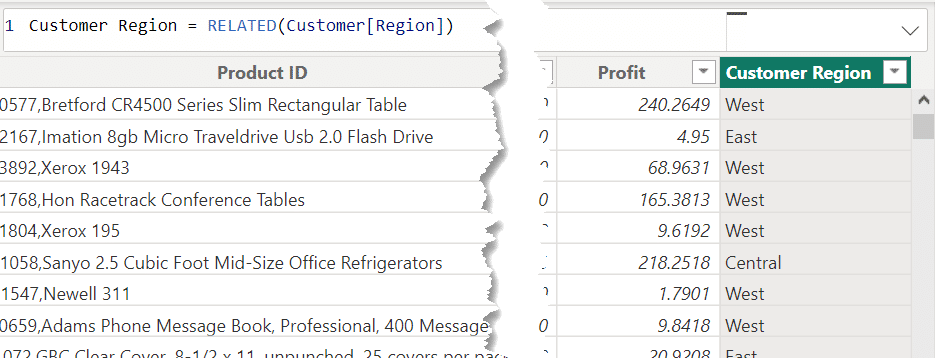
To bring up the relationship that is already deactivated, we use the NAVIGATION functions.
It is like JOIN in SQL and VLOOKUP in Excel.
These functions are RELATED AND RELATEDTABLE.
Make sure there must be an existing relationship between your tables before using the functions.
For example, you are trying to bring a new column (customer region) into your current table (sales) from another table (customer).
4.CALCULATED MEASURE
It is also an incredible feature which supports large database.
This is where we build dynamic formulas such as:
- total (sum of) profit
- total (sum of) sales
- time intelligence formulas (Year To Date (total) – YTD, Year on Year difference (YoY…)
- percentage share and so on.
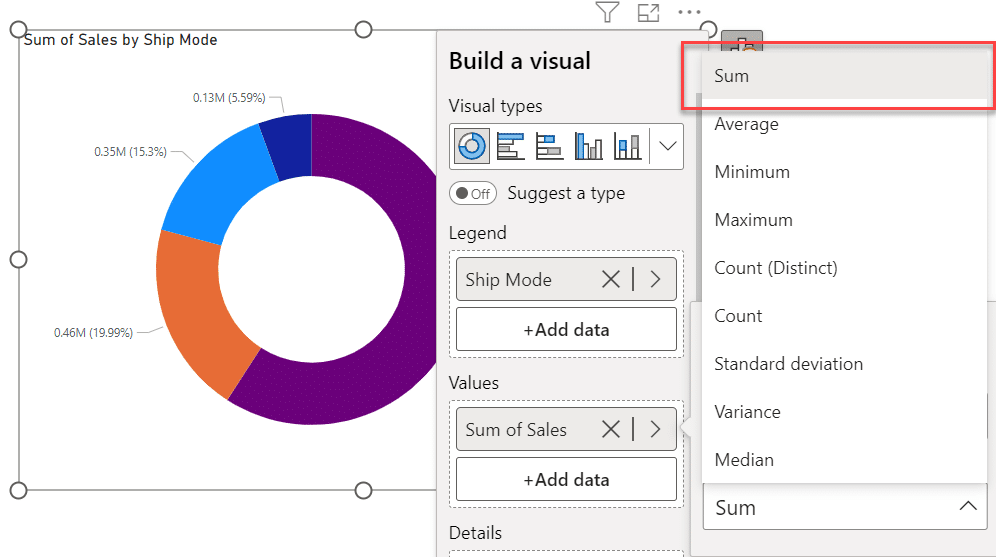
Anytime you see a value or numbers on a chart, those numbers represent measures.
Measures can either be implicit or explicit.
The implicit measures are inbuilt calculations (like the above image) which are in-built by Power BI engine. (Can be changed to another calculation but the calculation can’t be edited).
While the explicit measures are formulas manually created by the developer. (like the example image described for CALCULATE above) or using Quick Measures feature in Power BI. (can be edited)
Kindly note that the measures created needs to be applied before it can be seen.
5. CALCULATED COLUMN
A calculated column is basically you creating a new column in your data, (like example of Age Bracket column shown above) so as to add more analytical view to the data.
For example, you have a customer table containing both first name and last name and you need a single column that joins both columns.
In this case, you create a calculated column to concatenate both names.
Conclusion
Kindly be aware that these are not the overall scope of DAX.
Although, there are several concepts to learn, there are the key ones that make up 80% of the use cases for DAX.
In a later post I will talk about more concepts in DAX.
Enjoy the rest of your day and I hope this helps.

