Using DAX to implement Data Confidentiality
How does Power BI ensure confidentiality?
Row Level Security (RLS) is one of the key features that allow report creators access level control on their Power BI reports.
And Row Level Securities are defined with DAX.
Let’s assume that I have sales data with a field for Regions.
I have built a report with this data and need to share this report with different users, who are responsible for their respective regions.
I need to do this in such a way that, each user can only see the reports considering the region they are responsible for.
One wrong option I have is to split the data into the different regions, then build different Power BI reports based on the splits.
So, I’ll be sharing each report with the responsible users.
The right option is to use Row Level Security Feature in Power BI, on a single report.
With the help of DAX in RLS, we can create buckets of roles, with each bucket being a different region.
Then we can assign the users to those buckets according to the responsibility described.
In a nutshell, RLS is a way of limiting user access to defined portion of the data by applying filters (roles) on the data. And that process will be powered by DAX.
The roles must be defined on Power BI Desktop before activating the security in the Power BI Service.
This post will describe a simple process of creating Row Level Security on Power BI Desktop.
The Case Study
Our data is a sales data with a field for Regions. There are four regions (Central, East, South and West).
The idea is to create four roles, such that eventually, users can be assigned to a role. Each role will be a filter of the data to one of the regions.
We will create four roles as follows:
- Central View: Should include data for only Central Region
- East View: Data for only East Region
- South View: Data for only West Region
- West View: Data for West Region
Download the data here to practice with.
Creating Row Level Security in Power BI Desktop
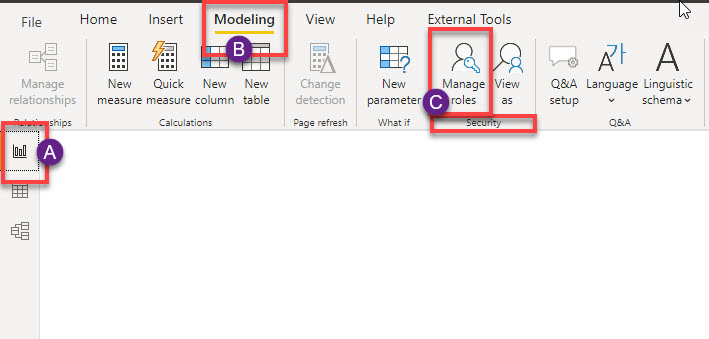
1. From the Report View, click on the Modeling Tab. Under the Security group, click on Manage Roles.
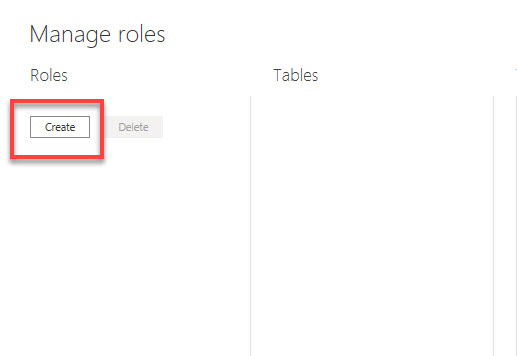
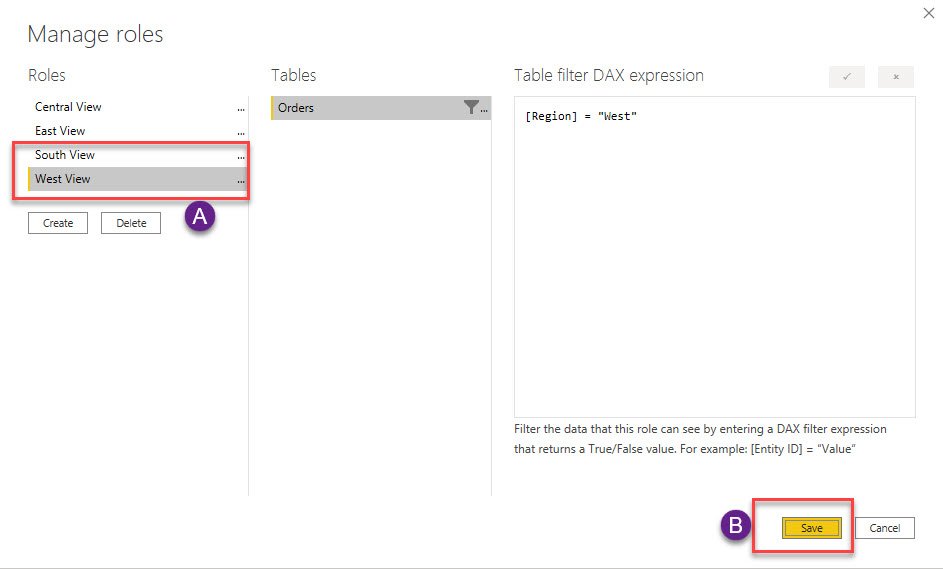
2. In the Manage Roles dialogue box, click on Create
3. For the first role, change the name from “New Role” to Central View.
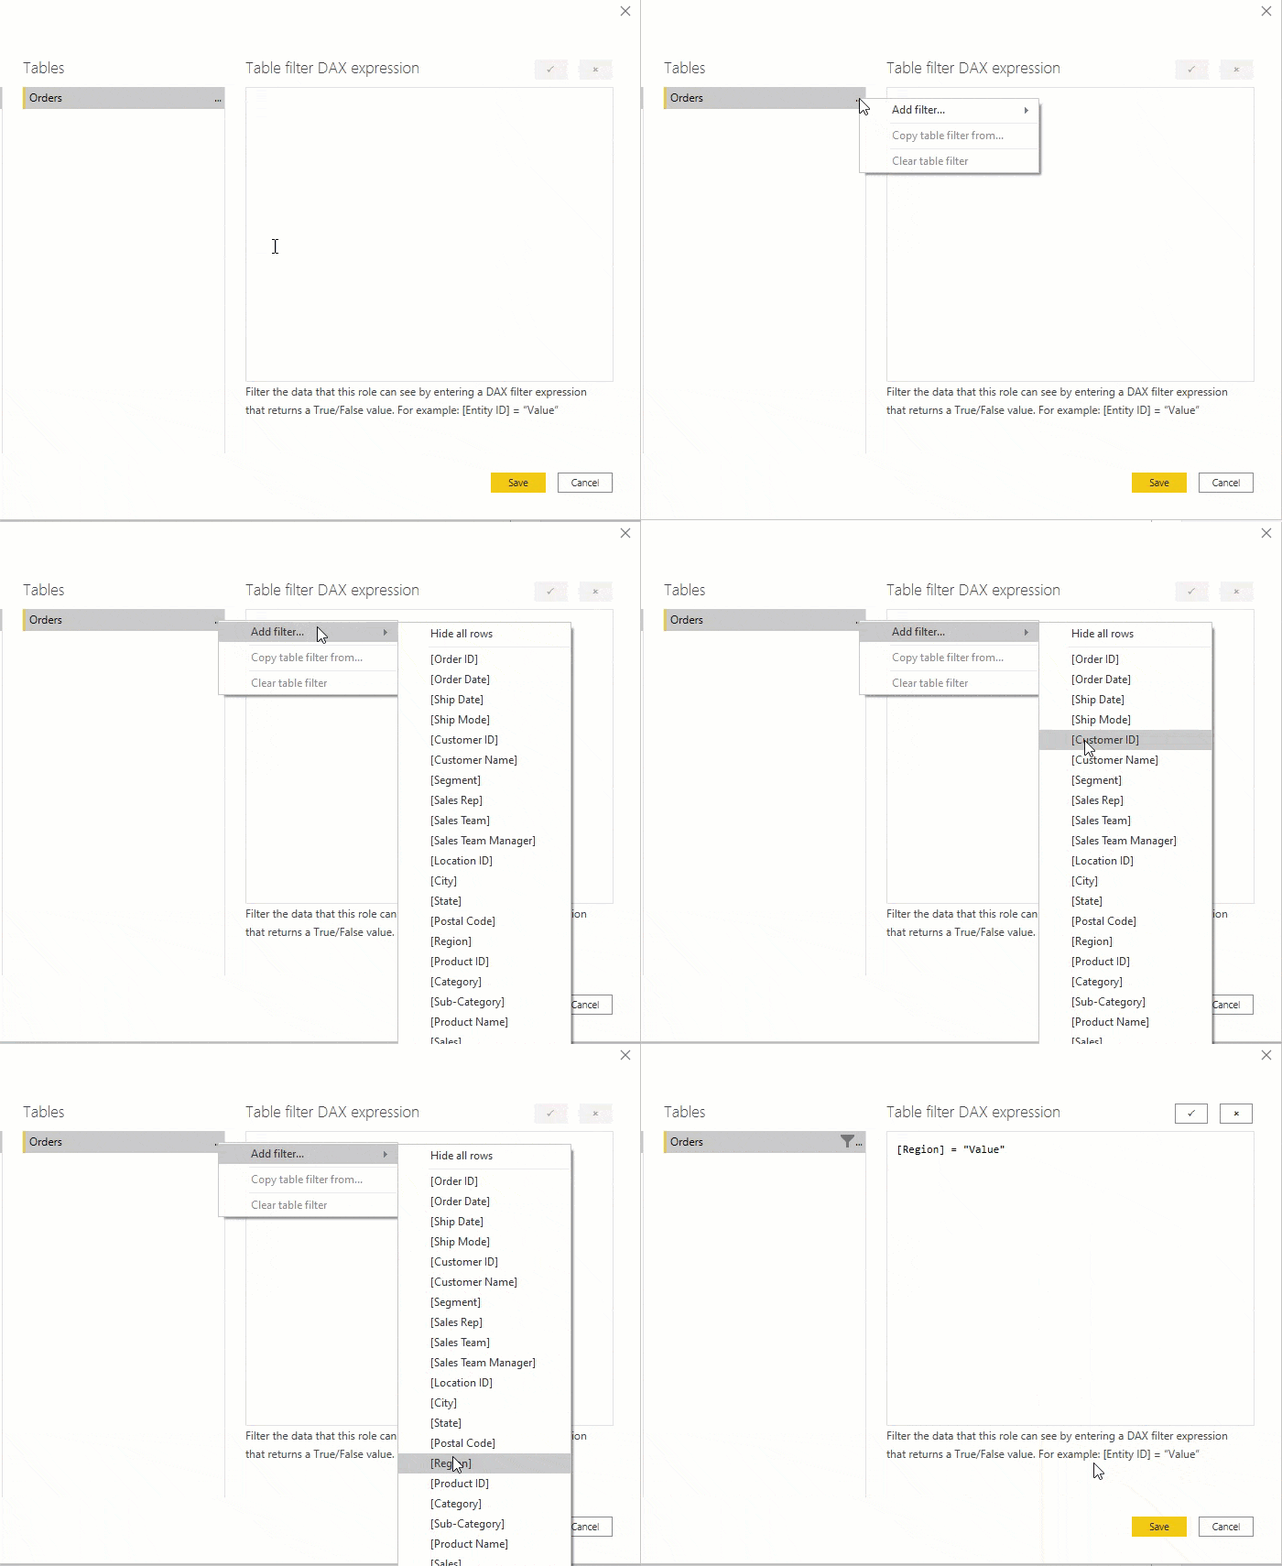
4. Under the Tables section, click on the ellipses on the Orders Table. Select Add Filters, then navigate down to click on Region.
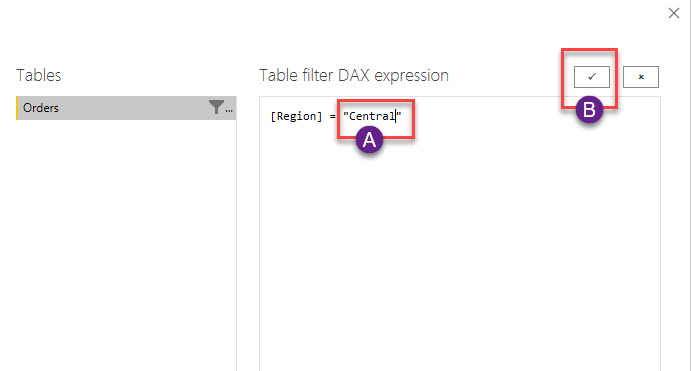
5. In the “Table Filter DAX Expression” box, change the “value” to “Central”. Then click on the tick Mark to enter the formula.
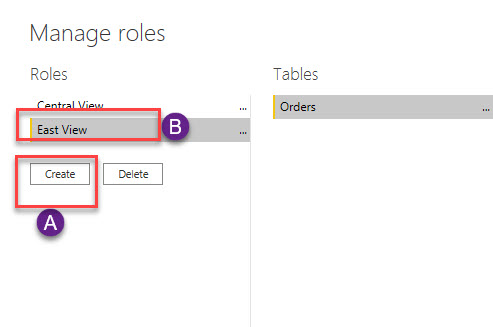
6. To create the next Role (East View), Back to the Roles section, click on Create and change the name to East View.
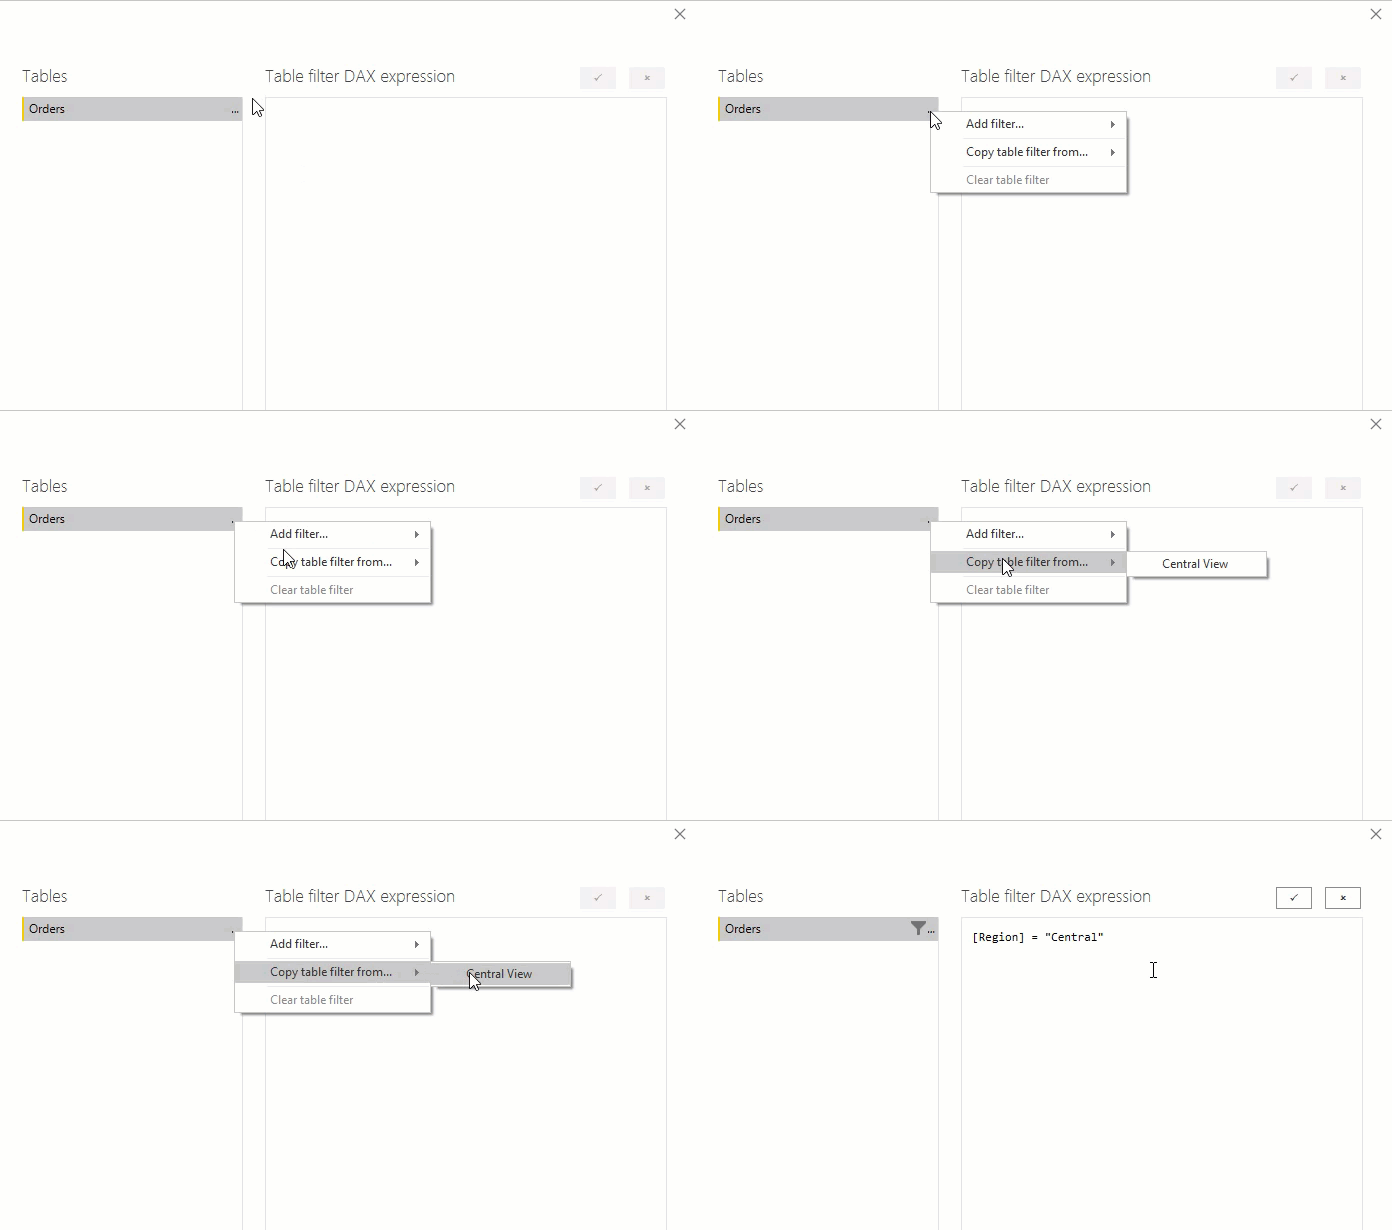
7. Under the Tables section, click on the ellipses on the Orders Table. Select “Copy Table Filter From”, then select Central View.
(Since the new filter is like the first one, we can copy it and just change the value in the formula to the new filter)
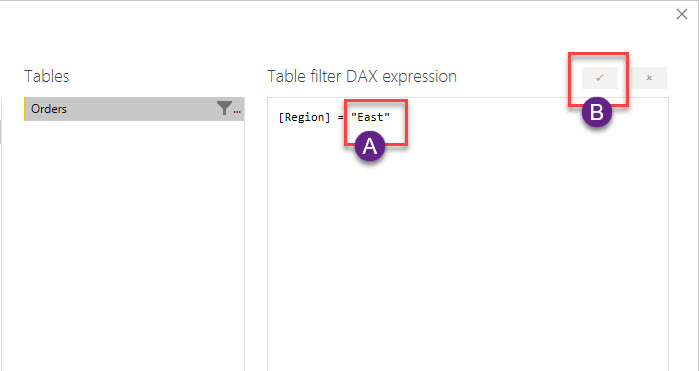
8. In the “Table Filter DAX Expression” box, change the “Central” to “East”. Then click on the tick Mark to enter the formula.
9. Repeat steps 6 to 8 to create the Roles for South and West then click Save.
Testing the Roles on Power BI Desktop
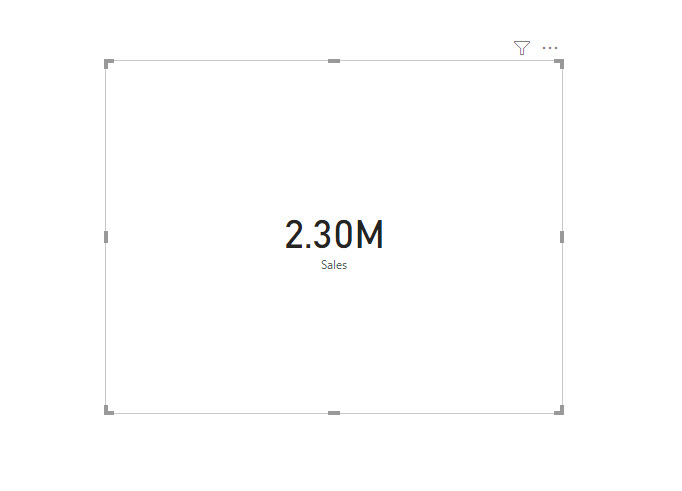
1. Create a simple Card Visual to show the Sum of Sales for this testing.
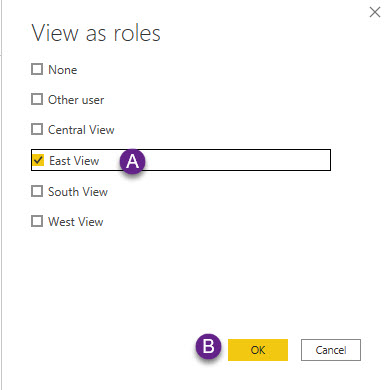
2. From the Modeling Tab, under the security group, select View as
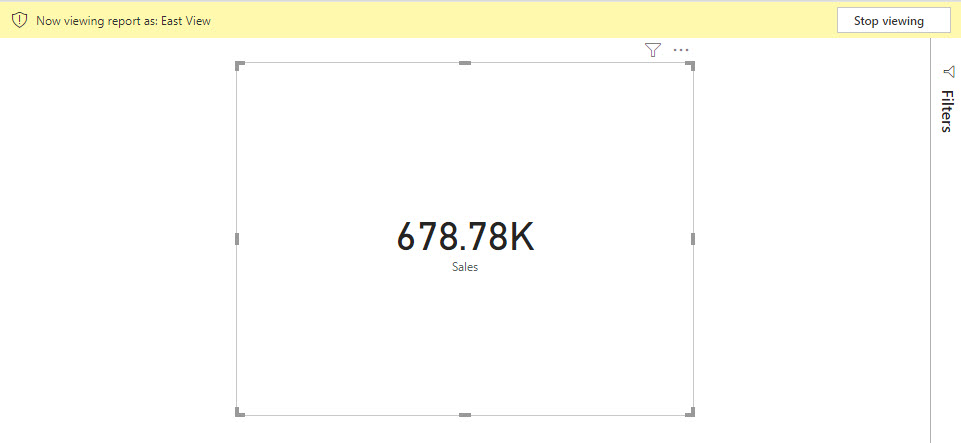
3. Using East View as a sample, check the box for East and click OK.
Activating the RLS on Power BI Service
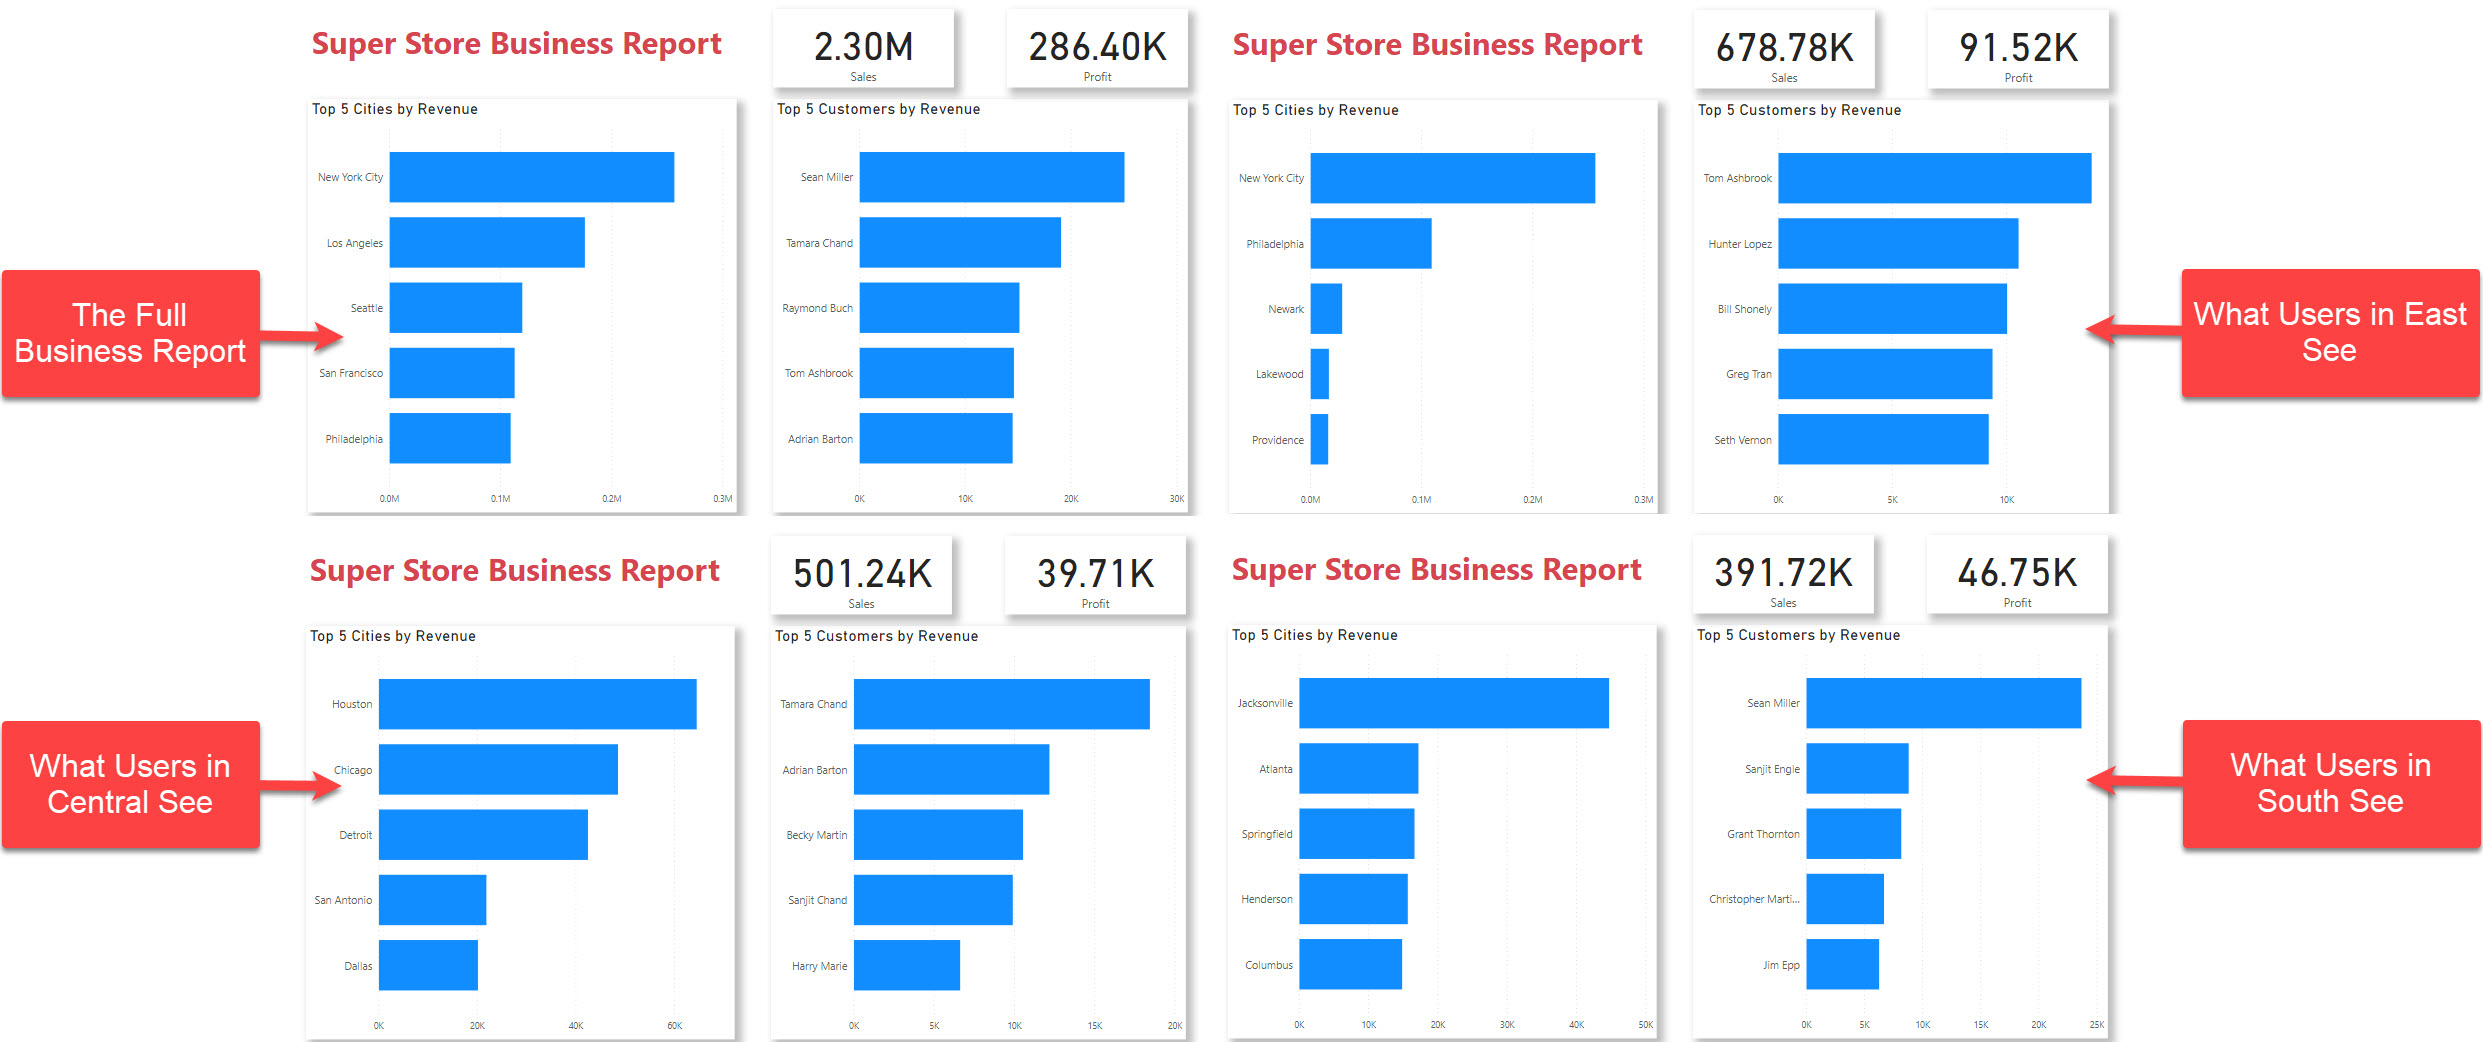
When this report is shared with users, the users assigned to East View will see Sales as 678.78K instead of the full value of the 2.30M of total Sales when no security filter is applied.
Other users assigned to other regions will also only see Sales as though, only the data for their region was used to prepare the reports.
Activating the Security will be done in the Power BI Service when the report is Published.
This can be done from the workspace that the report was published to.
Navigate to the Data Set section, click on the ellipses on the data set and select Security.
Then, for each role, type in a user’s name/email, select the user, click add and Save when all users for that role have been added.
Conclusions
Phewww! We have now covered the simple basics of what DAX can be used for in Power BI. Starting from Calculated Tables, Calculated Columns, Measures, and now, Row Level Security.
Starting Next week, we will begin to shine halogen lights on Measures.
We’ll start to go deeper into the technicalities required to master the DAX Language.
Hasta Luego!.

