Though, DAX can be a very wide subject with so many details, behavioral patterns and performance considerations to learn.
I introduced 5 Key DAX Concepts you should know in my previous post. I will continue in this article to highlight another 5 of the DAX concepts.
AGGREGATORS
Data is like written articles. While reporting is like summarizing key points in a written article.
The base of summarizing data are usually in forms of:
- counting data values
- adding up data values
- finding tendencies from a range of values
- getting the smallest values and the largest values etc.
Hence, DAX aggregators functions help in achieving these.
They help in calculating multiple values and returning a single value per data category.
Examples of Aggregator functions in DAX are:
- COUNT
- SUM
- AVERAGE
- MEDIAN
- MIN
- MAX.
These functions take in one column name as input parameter AND perform calculations on the column specified.
In summary, allow you to make data driven decisions by summarizing data over data categories.
For example,
- Number of Transactions = COUNT(Sales[Transaction ID)
- Total Sales Amount = SUM (‘Sales’[Sales Amount] )
- Mean (Avg) Sales Amount= AVERAGE (‘Sales’[Sales Amount] )
- Median (Avg) Sales Amount = MEDIAN(Sales[Sales Amount])
- Maximum Sales Amount = MAX (‘Sales’[Sales Amount] )
- Minimum Sales Amount = MIN (‘Sales’[Sales Amount] )
TIME INTELLIGENCE
One of the most beneficial ways of deriving insights from data is to compare numbers over a specific period. That is Time Intelligence.
Time intelligence functions help perform simple calculations over a specific period.
It is always required to have a DATE (aka Calendar) table in your Data Model when using those functions.
However, the Date Table should meet a condition. It must have a Date Column showing all dates from the first day of the first year to the last day of the last year.
E.g., for a regular calendar, this means 1 January Year 1 to 31 December Year Last.
And for a fiscal calendars such as April to March fiscal calendars, this means 1 March Year 1 to 30 April Year Last.
The Time Intelligence functions can be used in various calculations and measures to perform:
- period-over-period comparisons
- calculate growth rates
- or analyze trends over time.
Time Intelligent functions provide convenient ways to handle common time-related calculations
Here are some of the most used time intelligence functions:
- SAMEPERIODLASTYEAR
- DATEADD
- DATESYTD
- DATESMTD
- DATESQTD
- PREVIOUSMONTH
- PREVIOUSYEAR
- PREVIOUSQUARTER
- ENDOFYEAR, etc
CALCULATETABLE
Just like the CALCULATE function that is used to modify filter context across related tables in the data model, CALCULATETABLE does the same but returning a Table result.
For example, to compute Total Sales for Black product where Sales is from Sales Table and Black is from Products table. Both tables are related.
This formula can be written as:
SUMX ( FILTER (Sales, RELATED (Products[Color] = “Black”), Sales[Sales]))
But CALCULATE is able to refer to the products table without using the RELATED function. Because again, it is able to modify filter context across related tables.
So it’s possible to write something like CALCULATE (SUM ( Sales[Sales]), Products[Color] = “Black”)
A CALCULATETABLE on the other hand, returns a table format while CALCULATE returns a single value.
It helps create a virtual table on a given condition.
And this is required when you don’t want to change the main table, but rather bring out a subset table from the main table.
Although it is not mostly used unlike the CALCULATE function.
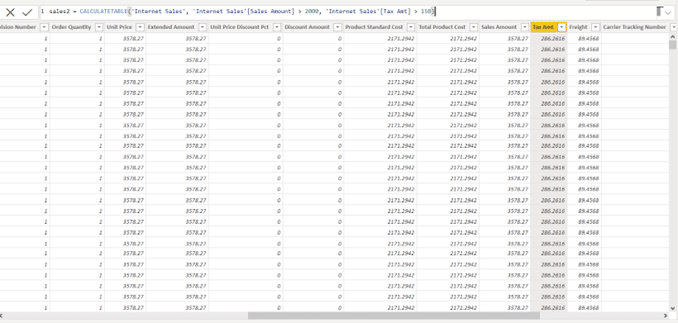
For example: You if you are to create a table that shows sales greater than $2000 and tax amount greater than 150.
The below image shows how you can create this table with CALCULATETABLE.
ROW LEVEL SECURITY(RLS)
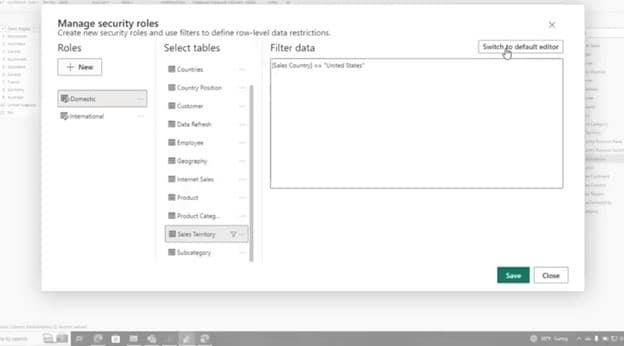
RLS is a security filter created in Power BI desktop using DAX to control data rows reports people are allowed to see in their reports and what they are not allowed to see.
Thereafter, it is published to Power BI service.
Here, you determine which user you want to give a particular type of access by inputting user email address to the roles created.
TIP – You can always create your roles on Power BI Desktop by clicking the HOME tab >>> Manage roles
UPDATE- There is a new updated row level security that was released with the updated version of Power BI in February 2023.
The new update gives you the flexibility of choosing between creating Row Level Security filters through button clicks or choosing the DAX editor option.
CROSSFILTER
The CROSSFILTER feature/function can be used whenever you want to perform analysis across dimension tables in your model.
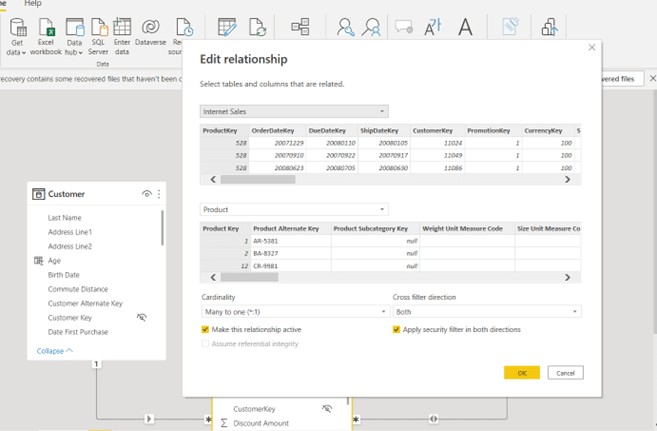
CROSSFILTER is used to change the direction of the relationship between tables.
It could be bidirectional, unidirectional, or disabled.
For example: If you are tasked to count the number of customers across each product.
And in this case, both the customer and product table are DIMENSION tables connected to the sales Fact table.
You can write a DAX formula to change the direction of the relationship of both tables or go to the data model view to effect the changes.
A DAX Measure is preferrable to fix it.
The importance of DAX for any Power BI developer cannot be over emphasized. Even though there are so many things to learn about it, a handful of basic concepts will solve 80% of DAX challenges.
If you would like to take a free DAX course to take your knowledge to the next level, check out this Mastering DAX Foundations Course.


