Have you ever felt like the Power BI Page or Canvas is too small to fit all of the visuals you would like to have on a single page, and the way you want them to be? Then you think of changing the page settings right?
Graph Book, Perimeter, Area , Ratios. What’s the relationship between these early days Mathematical Topics and the Power BI Canvas?
Hey, I know you are probably wondering what is there to know about Power BI Canvas settings. So I hope I’ll be able to surprise you with one or two things you probably didn’t know about it. Or just maybe you never thought about it that way.
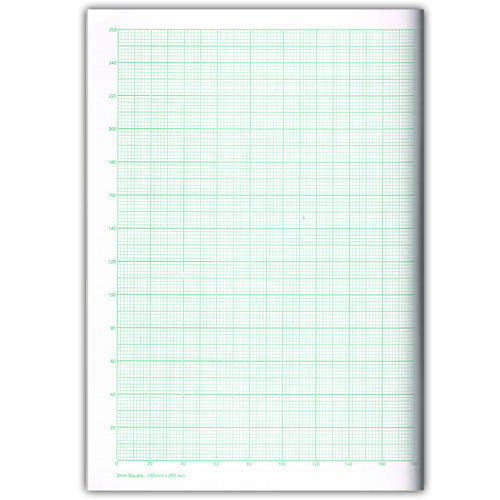
Graph Book
I am not widely travelled, only crossed the Nigerian Borders twice in my lifetime when I visited neighboring Benin Republic. But I hope sometime during your Primary/Elementary or Secondary/High School days (regardless of the Country where you were raised), you used an Exercise book we used to call the Graph Book.
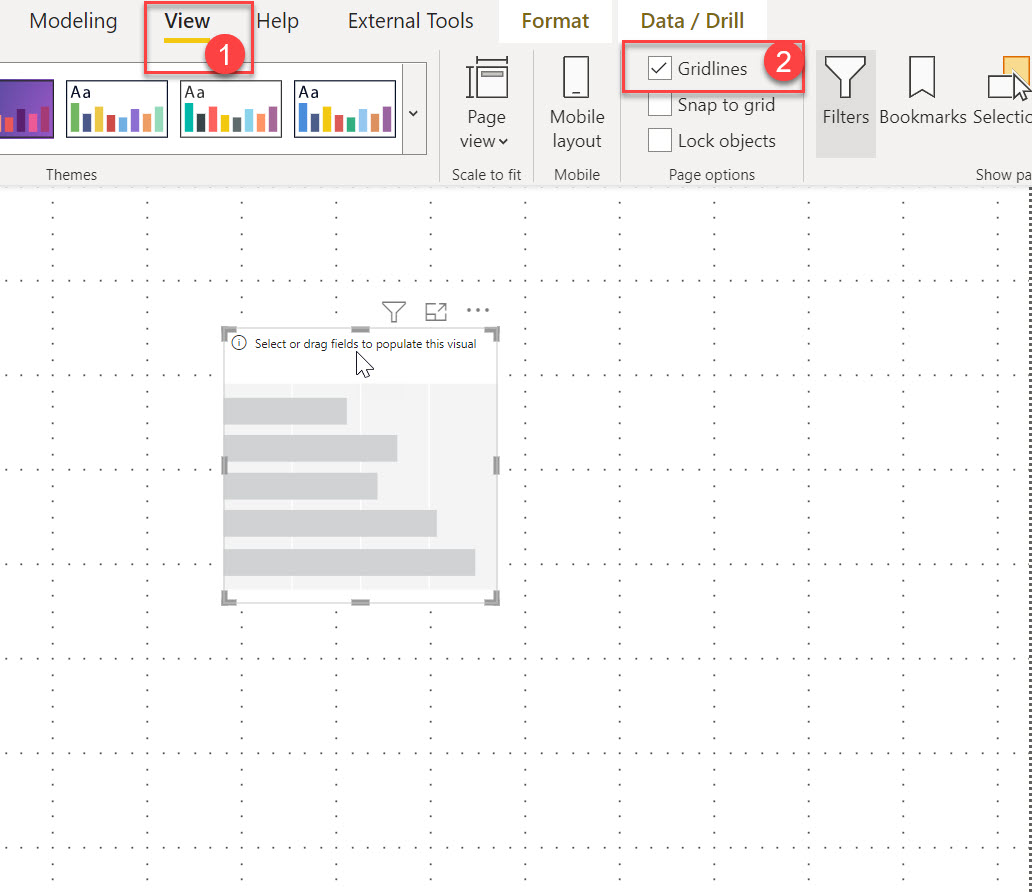
Technically, that’s what your Power BI Canvas is meant to be. Only difference is, Power BI Canvas does not have the lines on the Graph-book by default. Because you don’t need rulers in Power BI. But if you must see the lines (Grids), then you can put that on by going to View Tab>>Grid Lines.
The Gridlines will be displayed when you have an object on the Canvas.
So yes, for better precision in aligning objects on your Power BI Canvas, you may have to enable Gridlines during Development.
Perimeter
I am proud to remind you of the definition of Perimeter. Not like I remember myself, so I’ll use the Definition from KhanAcademy. “Perimeter is the distance around the edge of a shape”.
We are mostly used to measuring distance in Meters (m), Centimeters (cm) and Inches for smaller units. But when it comes to displaying things on Screens, Like Videos, Photos, Games, Like Power BI Reports, it’s not really about distance anymore. It now becomes a matter of Display. I always say, no matter how big a giant is, you can always draw him on a single piece of paper.
So when it comes to Display, you start to hear about Resolution and a Measurement unit called Pixels (px). You can always convert your way around all these units as always, just like 100cm makes 1m.
Ratio
So, objects you see, such as pictures have some Pixel Measurements. It is displayed the way it is, because of the Perimeter, the distance around the edges of the shape. The Length and the Breadth, if you think in Rectangular Shapes. The Length with it’s own px and the Breadth with it’s own px.
For Example, look at the image below:
It has it’s px for the lengths and breadths. That’s what makes it look the way you see it. Let’s assume it’s a 20 by 10. Mathematically, that is Ratio 2 to 1, or 2:1. That is referred to as the Aspect Ratio of the image. That is what defines the image the way you see it.
As you know, you can increase the size of an image. So, imagine increasing the size of the length from 20 to 40? You would have altered the Aspect Ratio, thereby, changing the image from the way you originally see it. Because it would now be 40 by 10. Mathematically, that is Ratio 4:1. You get it?
If on the other hand, as I increased the length from 20 to 40, I also increased the breadth from 10 to 20, that would have brought us to 40 by 20. The size of the image would have increased, and the ratio would still have remained 2 to 1. Right? 40 is 20 in two places and 20 is 20 in one place.
Power BI Canvas Settings
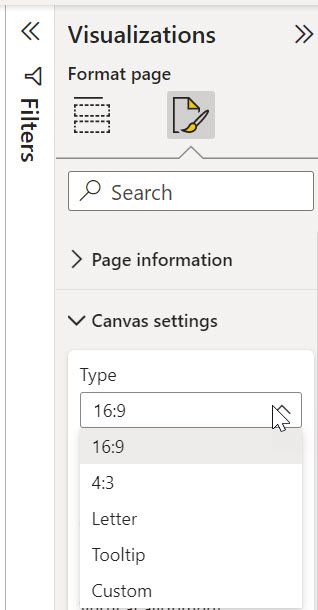
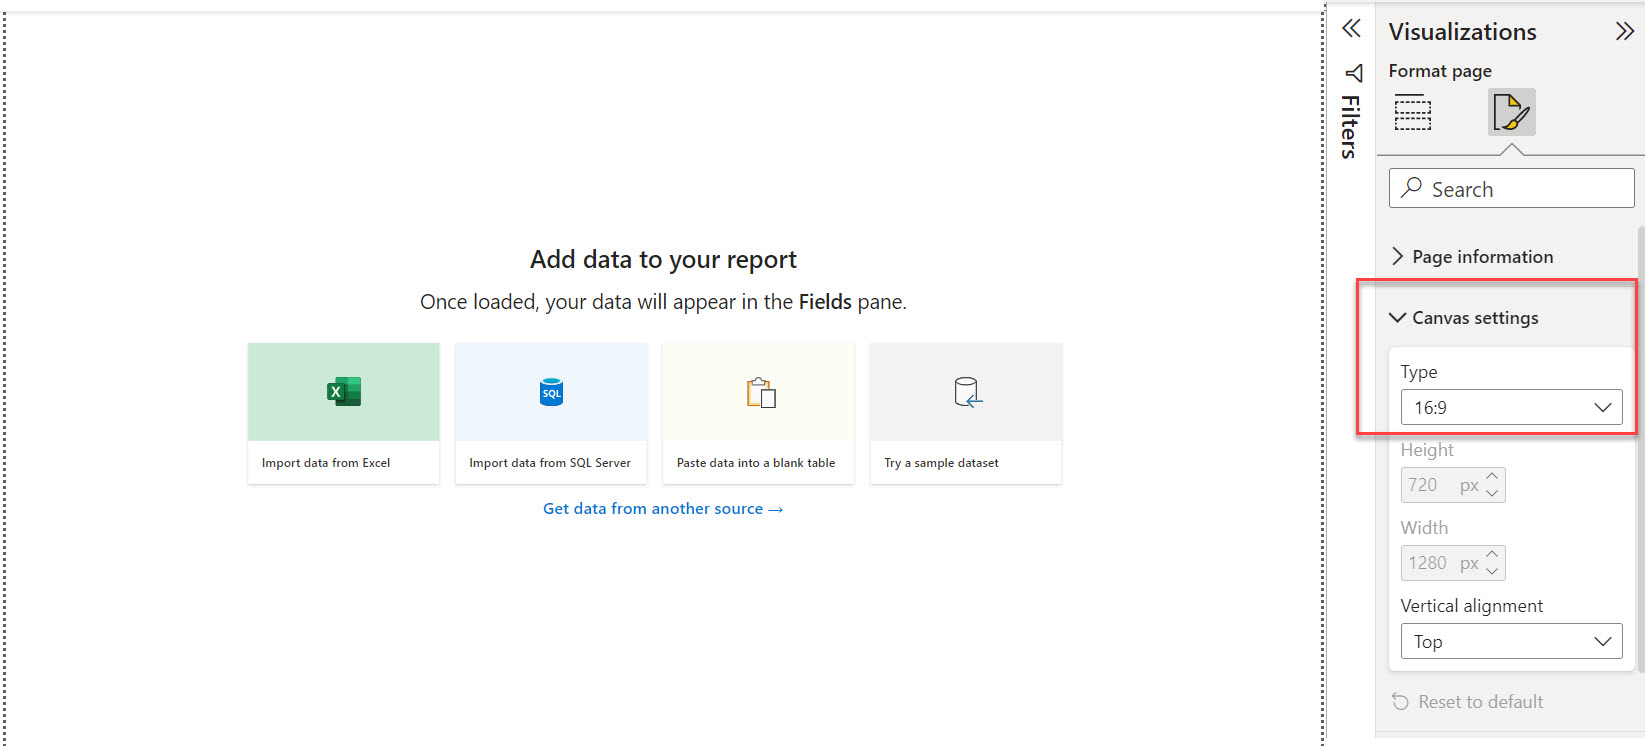
In the Canvas Settings Panel on Power BI Desktop, you will see Page Type options where you can choose between the most popular screen ratios (16:9, 4:3, Letter etc) and you can also customize that.
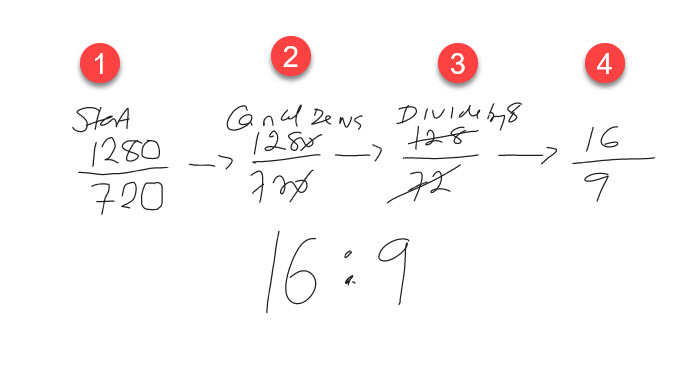
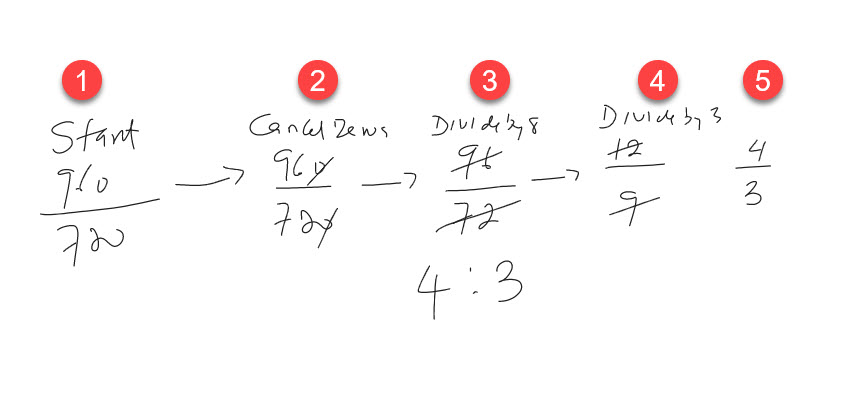
When you also look closer, you can see that each of those Page Types also include the height and width px. If you try to convert those of 16:9 (1280 by 720) and 4:3 (960 by 720), what you would get is 16:9 and 4:3 respectively.
Conclusion
Not a conclusion, but for sake a brevity, I’ll stop here for now. While I discuss how to use this knowledge of page sizes and pixels when designing Power BI reports and you feel like the Canvas size is not enough, and you need to customize the Page Type to increase it.
Until then, happy Remembrance (Of all those Mathematics Terms/Concepts).

