December 23, 2022
Data Visualization
June 28, 2022
Understanding Power BI Page Settings (Part 1)
Have you ever felt like the Power BI Page or Canvas is too small to fit all of the visuals you would like to have on a single page, and the way you want
November 28, 2020
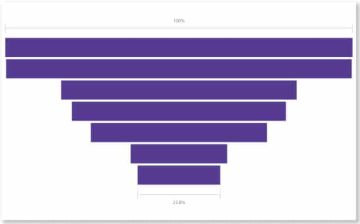
When And How To Make Use Of Funnel Charts In Power BI
So first of all, everything (data, maybe?) that’s poured at the top of this funnel doesn’t flow through the bottom. That’s not the reason for it being called a Funnel chart. Lol Now that
October 29, 2020
Be Smart With Smart Narratives
Have you ever spent so much time working on a Power BI visualization that when you are finally done, you just wish there was a way for the summary report to write itself while
October 10, 2020
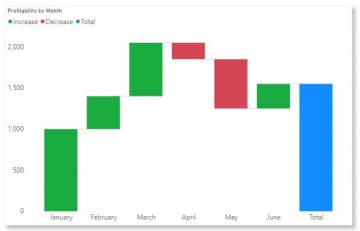
How To Use Waterfall Charts In Power BI
When talking about charts that are uncommonly used in Power BI, Waterfall Chart is usually not so far down on the list. Why? Who knows? Maybe users take one look at the chart (or
September 26, 2020
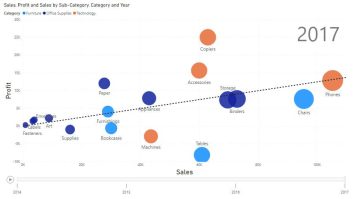
How To Use Scatter Charts in Power BI
Overview Scatter Plots in Power BI ! Can you count how many times you have used Scatter Plots for Power BI reports? I can and it’s not a lot. And I know for sure
September 19, 2020
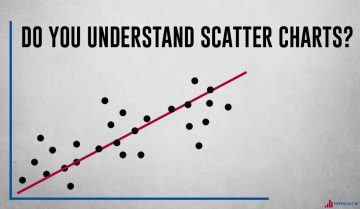
Do You Understand Scatter Charts?
Introduction Up until recently, Scatter Plots, also known as Scatter Charts or Scatter Graphs seemed like an unnecessary type of chart to me. I see it as an option among the other charts displayed
January 12, 2018


