Overview
A calculated column is a column that is calculated in the model. Which means, it was not imported with the data.
You see? The word “imported” was not casually included in that statement. Because If your connection to your data source is a “Live Connection” and not an “Import”, then you will have no business creating a Calculated Column in Power BI.
That functionality will not be available for you to use.
A calculated column is a fancy word for “New Column” in Power BI.
It is used when there is a need to include some data points in your report which are not in the original data, but can be derived from it.
Consider a situation where you have a column/field for “Quantity Sold” with values ranging from 1 to 10.
And you want to create labels for the ranges to indicate for example: “Small”, for sales between 1 and 3 quantities; “Large”, for sales between 4 and 6; and “Bulk”, for sales between 7 and 10.
You will need to derive a new column for that. That is a calculated column.
The idea of calculated column is not complicated. In this post, I will show you some examples just so that we can also learn about some DAX functions along the way.
Understand the Demo Data
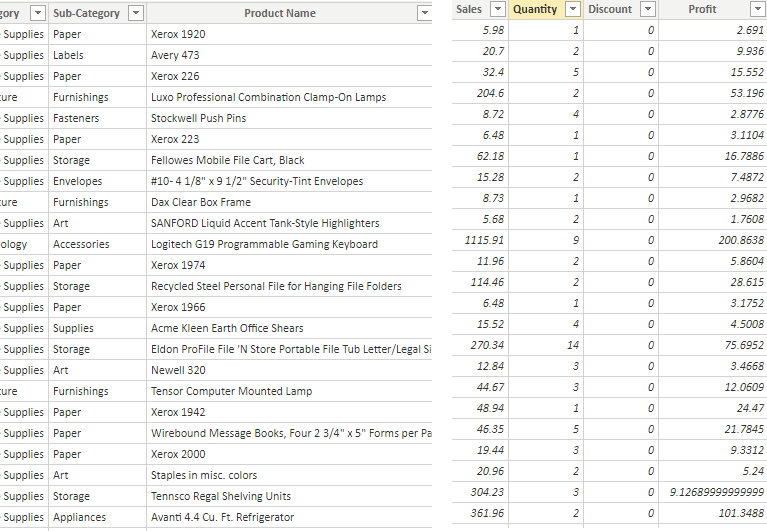
I will work a Super Store data set (Orders). It has data points for Sales, Quantity, Discount, Profit and some other columns to categorize all those numbers.
You can download the data here for your practice.
On this table, we will be creating the following “New Columns”:
- Cost: Since we have Sales and Profit fields, analyzing cost may also be important for us. So, we can create a column that will result from subtracting Profit from Sales.
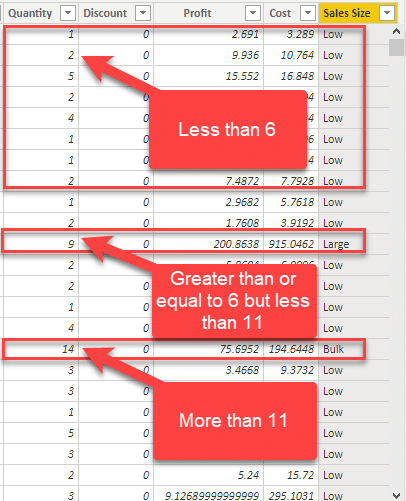
- Sales Size: Like the initial example I gave earlier, we want to classify our Quantity based on the number of quantities from each Order. Let’s assume Quantity below 6 are “Low”, below 11 are “Large” and anything after that are “Bulk”
Great! Let’s get started.
How to create Calculated Columns.
Many times, there are many ways to skin a cat in Power BI. To create a new column in Power BI, we can do any of the following:
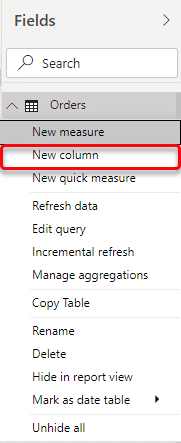
1. From the Fields Pane, right click on the table we are adding the new column to and select “New Column”.
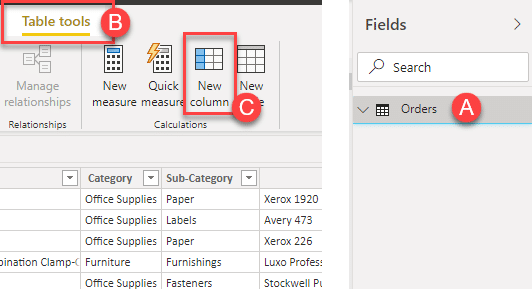
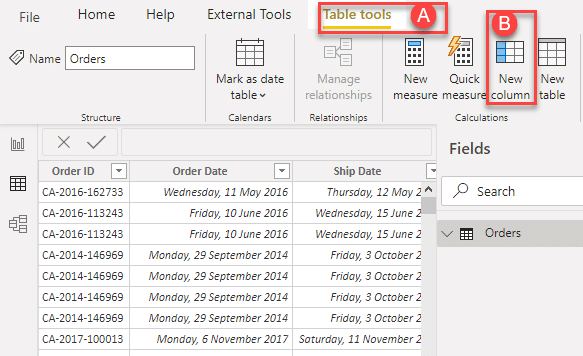
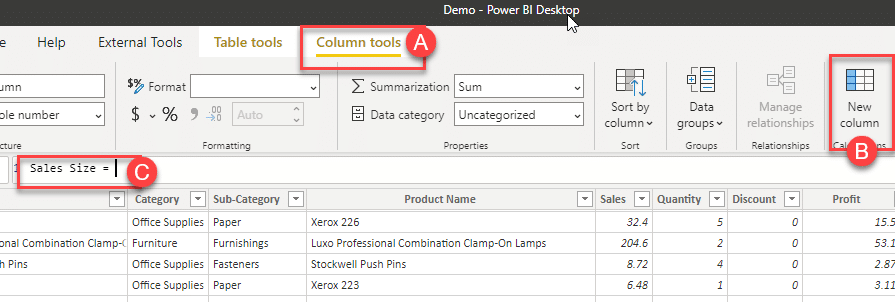
2. Select the name of the table we are adding a new column to, then click on Table Tools tab at the top and select “New Column”.
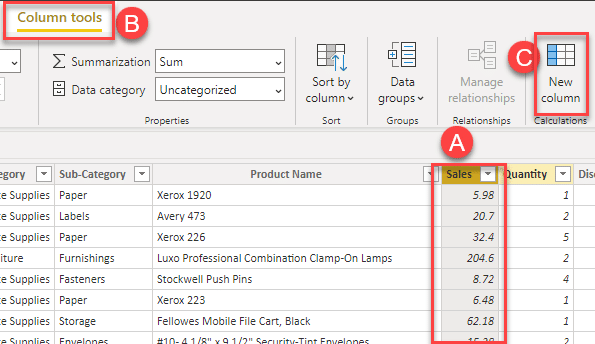
3. Select the name of any of the columns (either from the Fields Pane or from the Data View), then click on Column Tools at the top and select New Column.
While you can be in either the Report View or the Data view to be able to create a Calculated Column, it is advisable that you be in the Data View. So that you can have a good view of result of the column you are creating.
Different people have their own preferred methods of creating Calculated Columns.
And by the time you are done with this article, you would have discovered my own preferred methods. And you would have chosen any of the three methods for yourself too.
Let’s quickly complete our tasks, one after the other.
Task 1: Create a “New Column” for Cost
This is straight forward. We need to subtract the Profit Column from the Sales Column to get Cost.
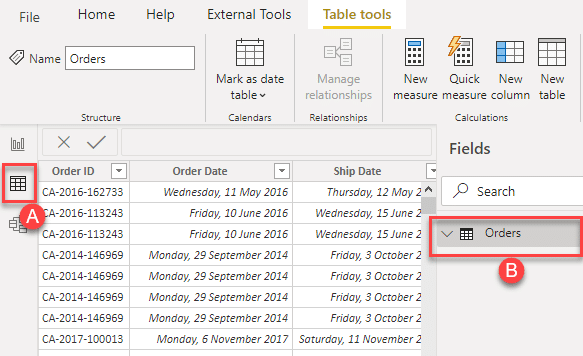
1. Staying on Data View, select the Orders table from the Fields Pane
2. Click on Table Tools tab and select New Column
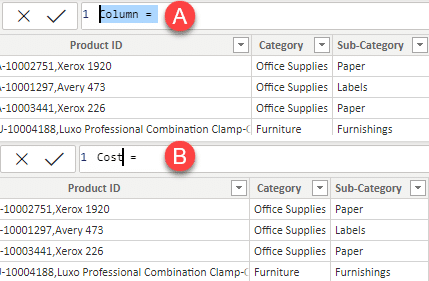
3. Change the name from Column = to Cost = and type in the formula below and press the Enter key on your keyboard.
4. Orders[Sales] – Orders[Profit]. (As you start to type Orders, intellisense displays a list of all columns on the Orders table and you can select from there as appropriate)
There are two things you can note from the formula above:
- Column names are prefixed with the name of the Table they belong to. That is how to reference columns in DAX. You must specify the name of the table the column belongs to.
- Spacing between the columns and the operator. Writing the formula as Orders[Sales]-Orders[profit] will also work, it just becomes more difficult to read formulas that are not properly spaced.
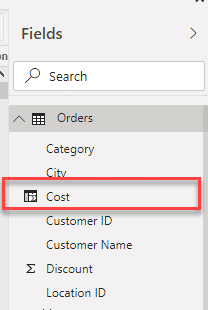
Also, if you check on the Fields Pane, you will see a new field called Sales, with a “square-ish” icon beside it. That icon is used to identify Calculated Columns in the model.
Onto the next task
Task 2: Create a “New Column” for Sales Size
Here, we are relying on a logic.
The logic is, for each row, If the value in the Quantity column is less than 6, the result should be “Low”.
However, if it is greater than or equal to 6 and less than 11, let it be “Large”. Every other thing should be considered “Bulk”.
We will use two methods to solve this. Each one using different functions. The IF and the SWITCH function.
The IF method
IF has 3 arguments: IF(LogicalTest, ResultifTrue, [ResultifFalse])
- Logical Test: The logic we are checking. Here, we need to check two logics.First, if the value in Quantity is less than 6, and secondly, if it is greater than or equal to 6 and less than 11.Looks like we will end up using two IF’s. After the first check, we use another IF for the second check.
- Value If True: The result to be displayed if the check in 1 occurs. That means it is true. Which will be “Low” for the first logic above. (Quantity Less than 6)
- Value if False: The result to be displayed if the check in 1 does not occur. That means it is False.
In our case, where we have 2 logics to test, after the 1st logical test and the value if true, we will start to check for the second logic by starting another IF.In the Value If true of the second IF, the result should be “Large” (Quantity greater than or equal to 6 but less than 11).When we get to the final Value if False of the new IF, we will use that to specify the result for the value that falls outside of the two logics tested. (Quantity is up to, or more than 11)
Now let’s create this.
1. Click on New Column. Change Column = to Sales Size =
2. Type in: IF(Orders[Quantity] < 6, “Low”, IF(Orders[Quantity] >= 6 && Orders[Quantity] < 11, “Large”, “Bulk”))
The SWITCH Method
Switch is also a logical function.
It has at least 3 arguments, It takes arguments in pairs.
A logical test and the result, another logical test and the result and where there is nothing more to test, the last value specified without a pair is the value if all other logics are not met.
The first argument in SWITCH is Expression. This is the Expression to be checked from all the other “value” arguments.
Here we will use the TRUE function as our Expression. Meaning, where the other “value” arguments are true.
The second argument is Value 1. This is the first logic to test.
The third argument is Result 1. This is the value to return when Value 1 evaluates to true.
The next arguments are in pairs of Values and Results and can easily be used to check for more Logics.
When a single value is specified without a pair, DAX sees that as the value to return when all previously specified conditions are not met.
To create the Sales Size Column using the switch method:
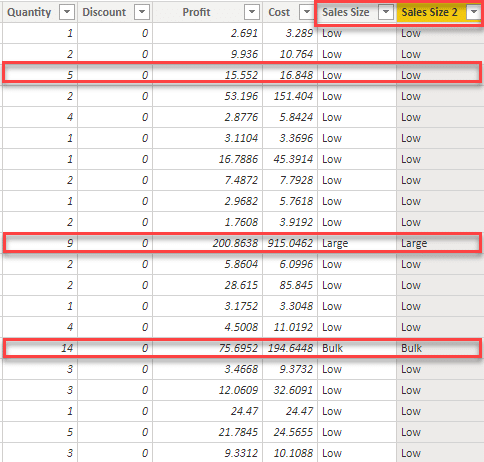
1. Create a “New Column” to be called “Sales Size 2”
2. Type in the formula: SWITCH(TRUE(), Orders[Quantity] < 6, “Low”, Orders[Quantity] >= 6 && Orders[Quantity] < 11, “Large”, “Bulk”).
The SWITCH function eliminates the use of multiple IFs and can be easier to read when you understand it.
Conclusion:
If you check all of Zainab’s posts on Creating Date Tables (Part 1, Part 2, Part 3), she created a couple of Calculated Columns there.
You can use that to add some new functions to your DAX functions Library.
Do that, and you would have gotten a good practice for the week and know how to use about 10 DAX functions already.
I can not end without saying: Ensure you practice this. You learn DAX by practicing.

